
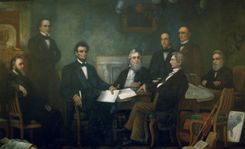
First Reading of the Emancipation Proclamation of President Lincoln
In this iconic portrait, Carpenter carefully reproduced the Coast Survey’s map of slavery in the lower right corner after noticing Lincoln’s attention to it.
The sectional crisis sparked tremendous creativity in mapmaking, as Northerners began to use maps to measure the extent of slavery. This includes the first statistical maps of population made in the United States, which even captured the attention of President Lincoln during the Civil War.
In this iconic portrait, Carpenter carefully reproduced the Coast Survey’s map of slavery in the lower right corner after noticing Lincoln’s attention to it.
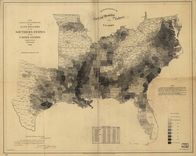
One of the first American attempts to translate the census into cartographic form, and a favorite of President Lincoln during the Civil War.
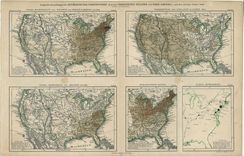
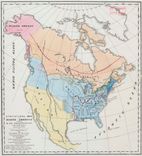
A European was the first to map American census data. The map at lower left shades the density of the slave population, and identifies the number of slaves per square mile.
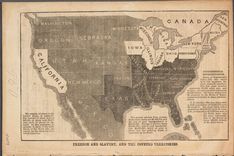
Anti-slavery activist John Jay used this map to alert northerners to the threat of slavery in the west, and to promote the cause of the newly-founded Republican Party in the 1856 presidential election.
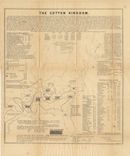
This is typical for its time: the title claims it as “statistical,” the data is simply listed on the map. Soon thereafter maps would begin to represent statistics through shading and other techniques.
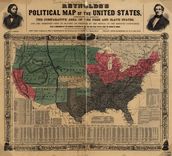
One of several maps made to promote Republican John Fremont’s campaign for president in 1856. Note that Kansas is highlighted, the center of violent conflict over slavery.
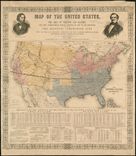
One of many maps created for the 1856 election. The dark lines across the interior represent the expeditions of John Fremont, Republican candidate for president.
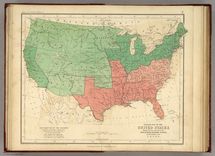
Here Johnston distinguished between states important and exporting slaves in order to convey areas of growth and decline in the south.
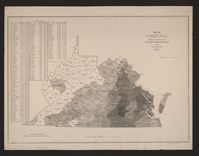
The Coast Survey executed this map just as Virginians were debating secession in order to highlight the different interests around slavery in the state.
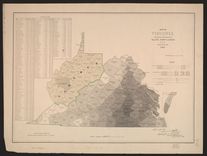
The Coast Survey’s second map of Virginia was modified to reflect to growing division in that state during the secession crisis. Note the identification of “Kanawha.”
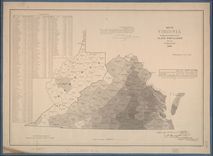
The final edition of the Virginia slave map used Census data to pointedly illustrate the relative absence of slaves from the western half of the state.
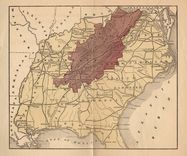
The Coast Survey’s map of slavery inspired several variations, including this map illustrating a military strategy to defeat the Confederacy.
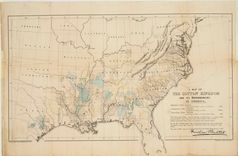
Olmsted issued this map in the midst of the secession crisis to convince the British to withhold support for the Confederacy; it is the first attempt to measure cotton production on a map.
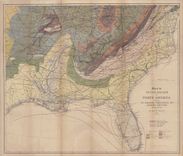
Mallet designed this complex map to guide the British as they developed cotton in India, drawing on existing geological and environmental maps from the era.
Atkinson designed this map to convince northerners to embrace the Emancipation Proclamation as a path to a more efficient system of free labor.