
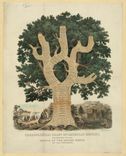
Chronological Chart of American History
Dalston’s chart is a variation on Emma Willard’s tree of time, and detailed early growth in the roots out to recent developments in the branches. Note the stages of social progress.
11 maps found
Dalston’s chart is a variation on Emma Willard’s tree of time, and detailed early growth in the roots out to recent developments in the branches. Note the stages of social progress.
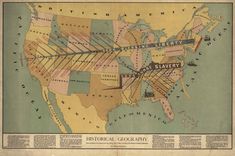
Notice the zealously sectional interpretation of history in this map, especially the identification of northern liberty as emanating from Christianity, in contrast to southern slavery.
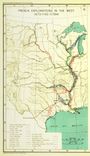
This map adopted techniques used almost a century earlier by Johann Kohl to represent the stages of discovery through the use of color.
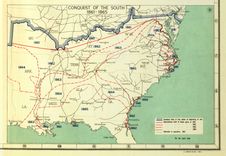
Here the Civil War is represented in stages, as popularized by Henry Lindenkohl and the U.S. Coast Survey in the “Sketches of the Rebellion,” included above.
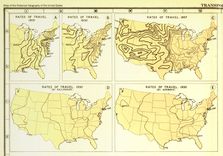
Here Charles Paullin represented advances in transportation technology in geographic terms in order to depict the qualitative changes over the course of American history.
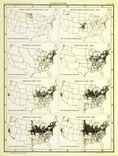
Geographer John Wright devised these maps to represent the dynamism of agricultural growth in American history. Each map represents change over a ten year period.
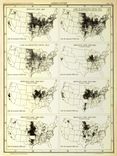
Geographer John Wright devised these maps to represent the dynamism of agricultural growth in American history. Each map represents change over a ten year period.
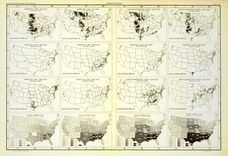
Geographer John Wright devised these maps to represent the dynamism of agricultural growth in American history. Each map represents change over a ten year period.

This graphic depiction of history evokes Emma Willard’s “picture of nations” a century earlier, and was one of Rand McNally’s most popular sellers in the twentieth century.
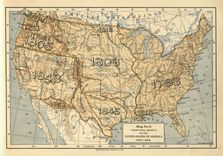
This type of map became popular in American schools in the late nineteenth century, a powerful visual depiction of the nation’s historical expansion and ideas of manifest destiny.
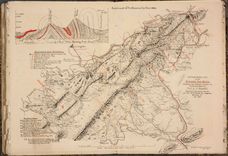
Hotchkiss created this to lure capital to the region for mining and railroads alike. Note the candor in the lower left corner, and the attention to topographical detail.