The cartographic response to the secession crisis
Last April, CSPAN taped a lecture in my Civil War course for its “American History TV” program. The lecture aired this weekend, and I was heartened that people would actually watch a 90 minute lecture on the secession crisis (who knew?).
In that time I traced the crisis from the election of Lincoln through to the onset of hostilities the following summer. The centerpiece of the lecture was a series of maps made by the United States Coast Survey, which translated the statistics from the 1860 Census into cartographic form. Here is the first attempt, a map of slavery in Virginia that was issued in June of 1861, just after that state voted to join the Confederacy.

Click to open in new window.
This map–lowly and plain as it appears–was a cartographic breakthrough. As I discuss (in excruciating detail) in chapter 4 of Mapping the Nation, it was the first American attempt to map Census data. It was also the first American attempt that I have found to map any population data. The table at left ranks the counties of the state not according to the size of its population, but the size of its slave population.
The map was also significant for its political and military context, for it was issued at the height of the debate regarding the separation of western Virginia from Virginia. Immediately after Virginia voted to secede in April, those in the western counties (anticipating such a move) began to organize to create their own separate state. The map was released at the height of this campaign in the summer of 1861, just as McClellan’s forces invaded western Virginia in order to secure those counties long enough for residents to organize. I have found editions of this map with inscriptions by military leaders: they shared it because it shed light on the complex, divided nature of Virginia.
The map was reissued three times in the summer of 1861, which indicates that the Coast Survey realized those working for the agency knew they were on to something . I believe it was issued to actually influence the debate within Virginia, by making clear how little those in the west shared with their eastern counterparts.
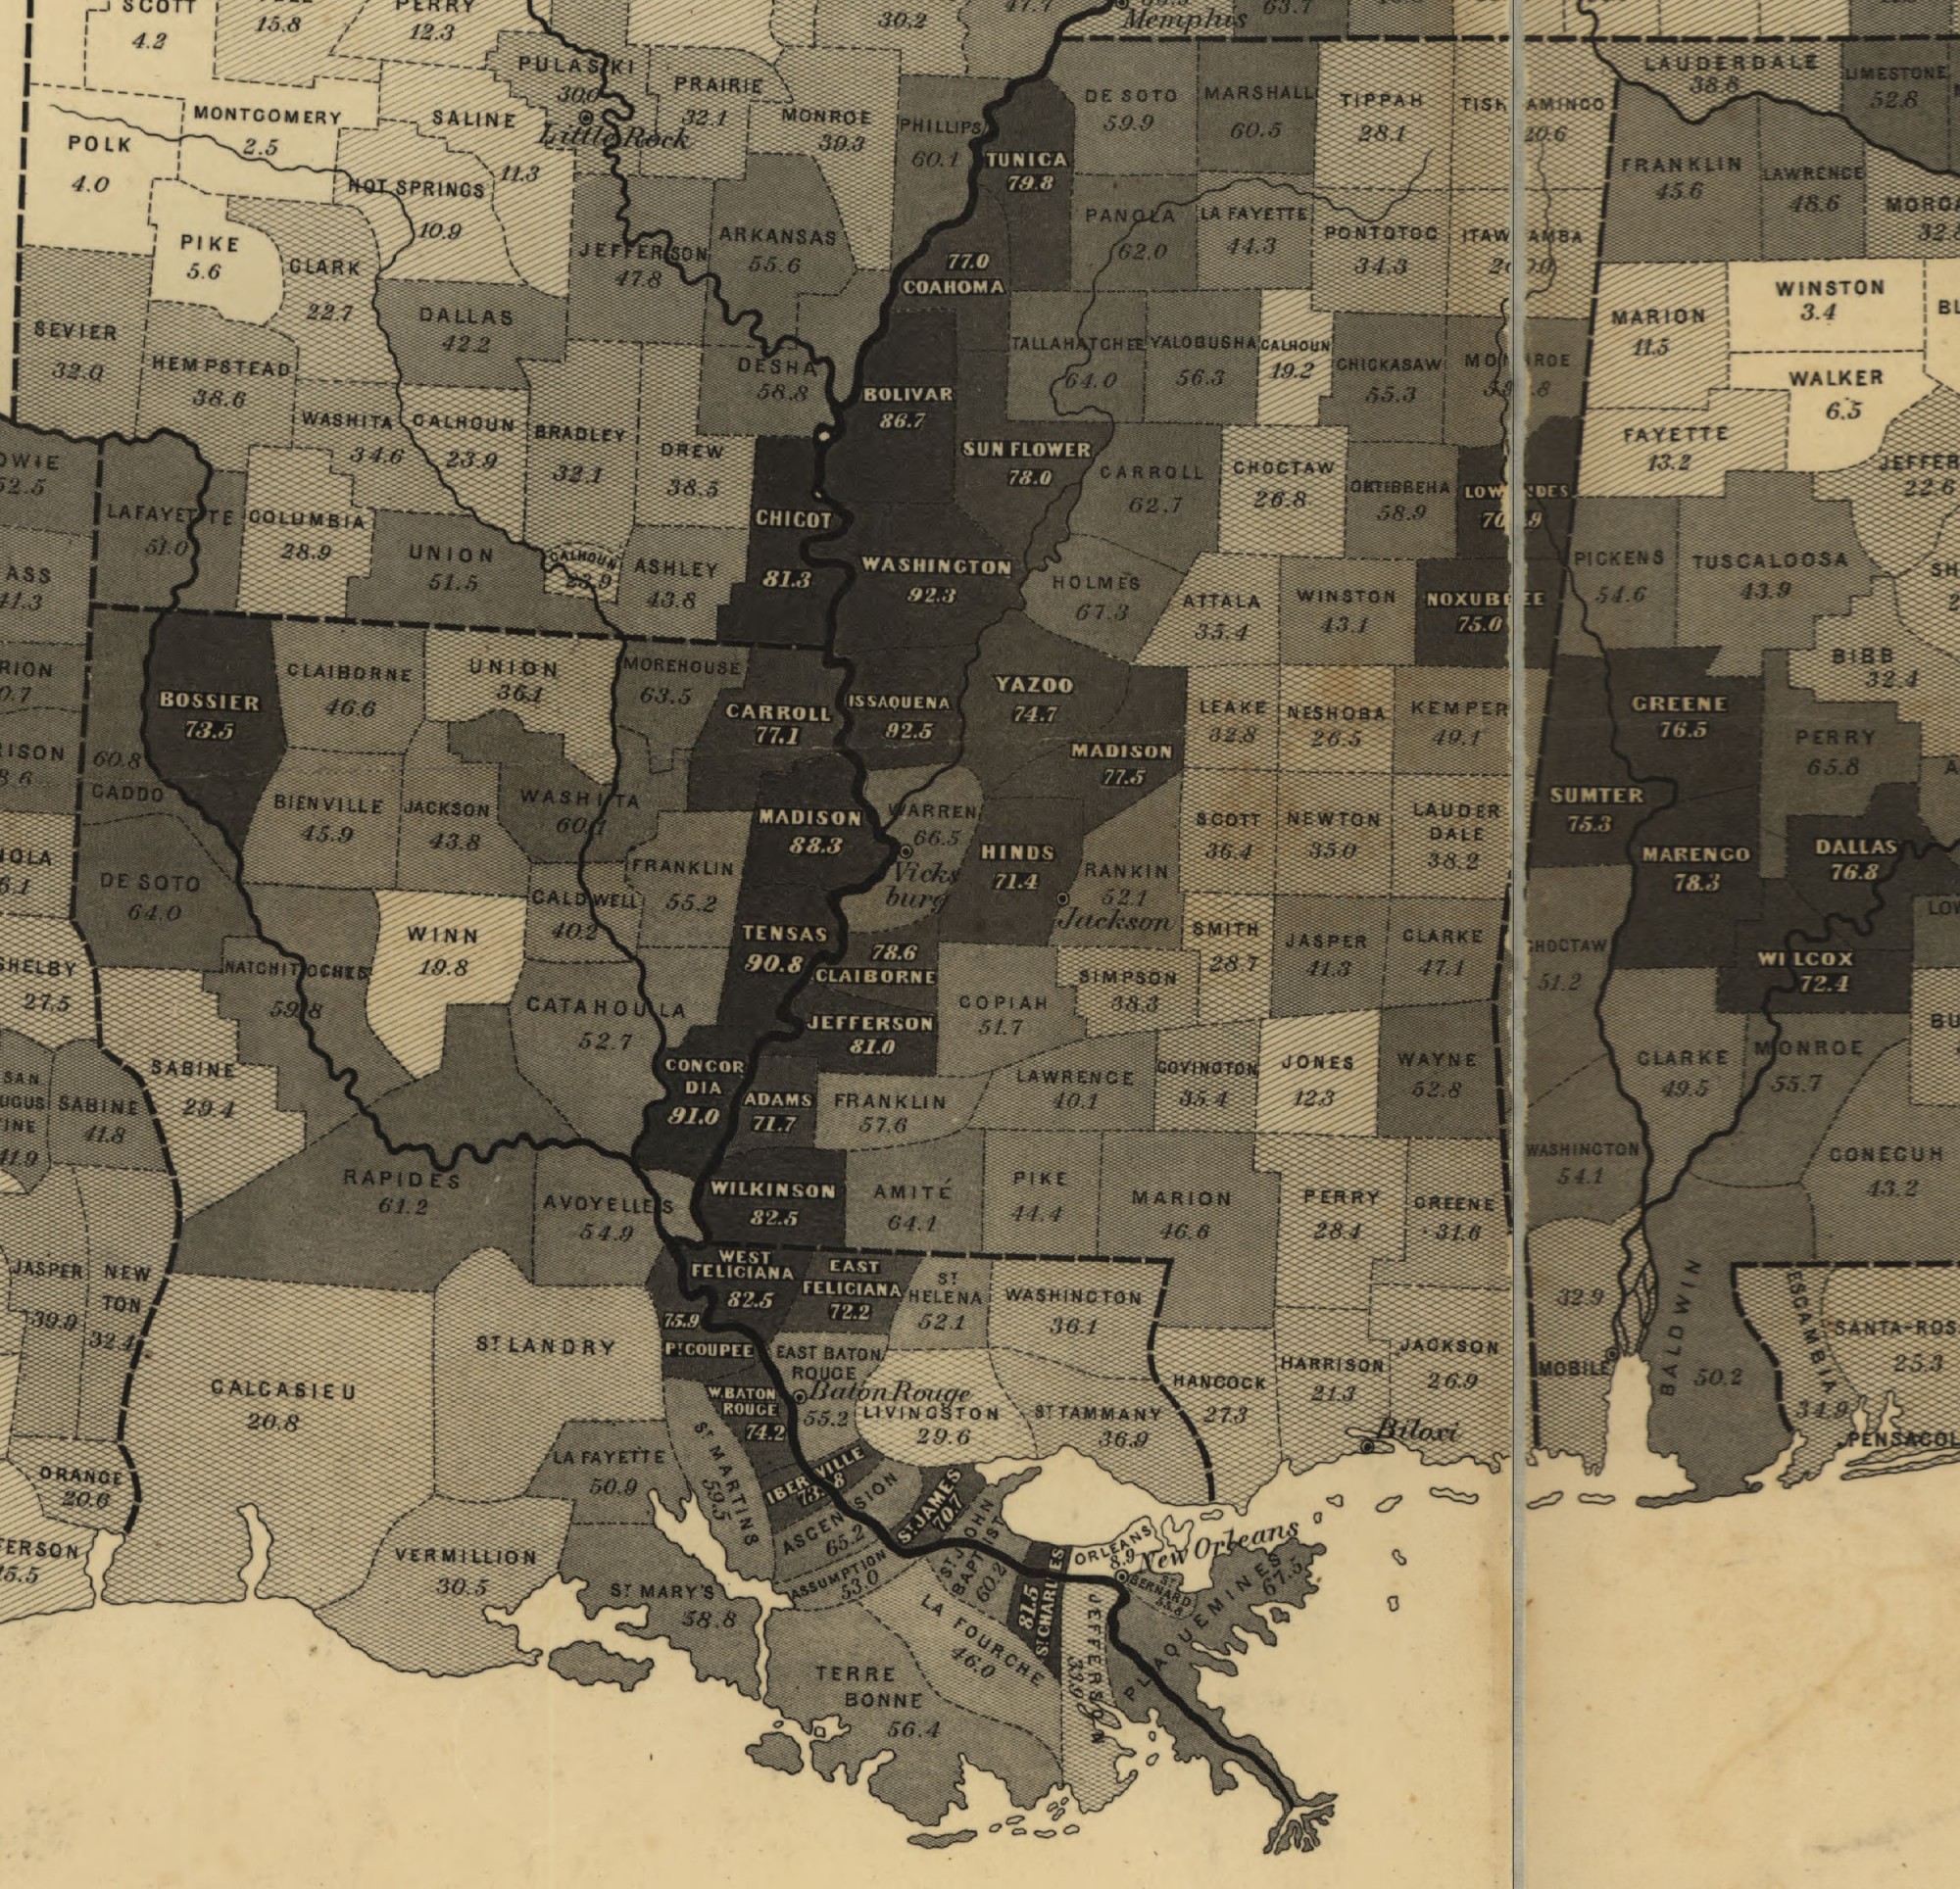
In September 1861, the Coast Survey extended this same mapping technique to the South as a whole.

Click to open in new window.
There is a great deal to discuss about this map, and I’ve only begun to understand its importance. It was copied during the war, and even caught the attention of President Lincoln, so much that it was detailed in the lower right corner of Francis Bicknell Carpenter’s famous portrait of Lincoln announcing the policy of emancipation to his Cabinet in the summer of 1862.
But here I simply want to draw attention to the sheer variation it illustrates. The South is not presented as homogeneous or monolithic, but encompassing several regions of varied–even conflicting–interests. Our eye is drawn to the dark regions (reminding us that these were the heart of secessionist sentiment), but notice as well the areas where slaver is nearly absent, even in the deep South.

Click to open in new window.
I have used the map to showcase some of contemporary understandings of secession and the war. I’ve also stressed its importance as an early statistical map, launching a genre that would explode after the war. But I welcome other responses — what do you see in the map? How might we think about it as a piece of historical evidence? What place might it have had in the secession crisis and the ensuing war?

Click to open in new window.
Use controls to zoom and pan.
I am a Civil War buff. I am assuming the 82.5 in Wilkerson Ct., MS and in West Feliciana, Ct., LA are percentages of the population who were slaves at the time of the 1860 census. A distant and remote ancestor of mine, Judge Edward McGehee owned a 29,800 acre plantation near Woodville in Wilkerson Ct with 736 slaves. These numbers certainly support these high percentages by the slave map of Mississippi. Incidentally, McGehee also had a plantation in West Feliciana and constructed a railroad between the two to transport cotton. It was the first interstate RR in the nation and the first with standard gauge. His large family and their life became the setting of the book “So Red the Rose” by Stark Young published in 1934 which became the basis for the first movie about the Civil War from an agrarian southern viewpoint.
Charles