A picture of American faith
I have a piece today in Fast Company Design about the nineteenth-century origins of modern infographics, both thematic maps but also other forms of graphic knowledge like timelines.
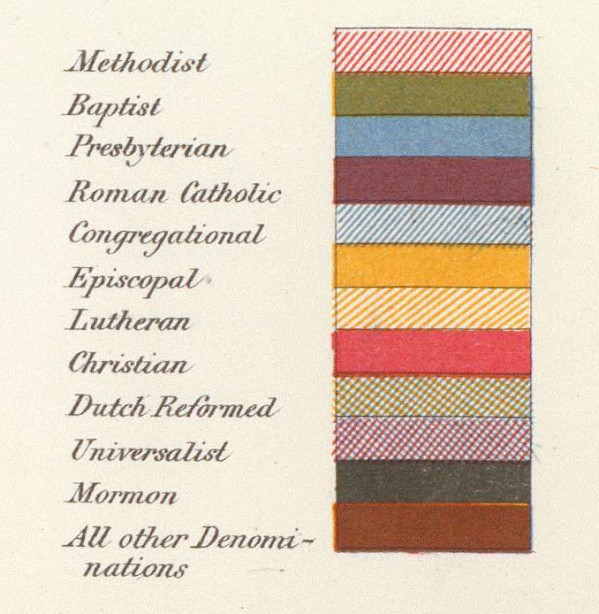
One of the most elegant is Francis Amasa Walker’s 1874 chart of church accommodation.

Click to open in new window.
Walker was the young Superintendent of the 1870 Census, and his work is covered extensively in chapter five of Mapping the Nation. He launched the first Report of the Census in 1872, then convinced Congress to fund an ambitious statistical atlas of the United States, the first of its kind. The result was a landmark — the first national statistical atlas published anywhere.
Walker’s motives are complex: he developed a deep concern with what he considered excessive urbanization (as well as immigration). But here what is most fascinating is his interest in transforming Census data into visual form to speak to the widest possible audience.
In this chart, Walker arranges the denominations according to shading, as below.

He then a second layer of information — those who identify no church affiliation — in the grey border around each state. Thus the viewer was able to see the degree of church attendance as well as the distribution of denominations.

Apparently people in Ohio were a bit more devout than those toward the west.
With thanks to David Rumsey for access to the chart.
Use controls to zoom and pan.