Mapping vice in San Francisco
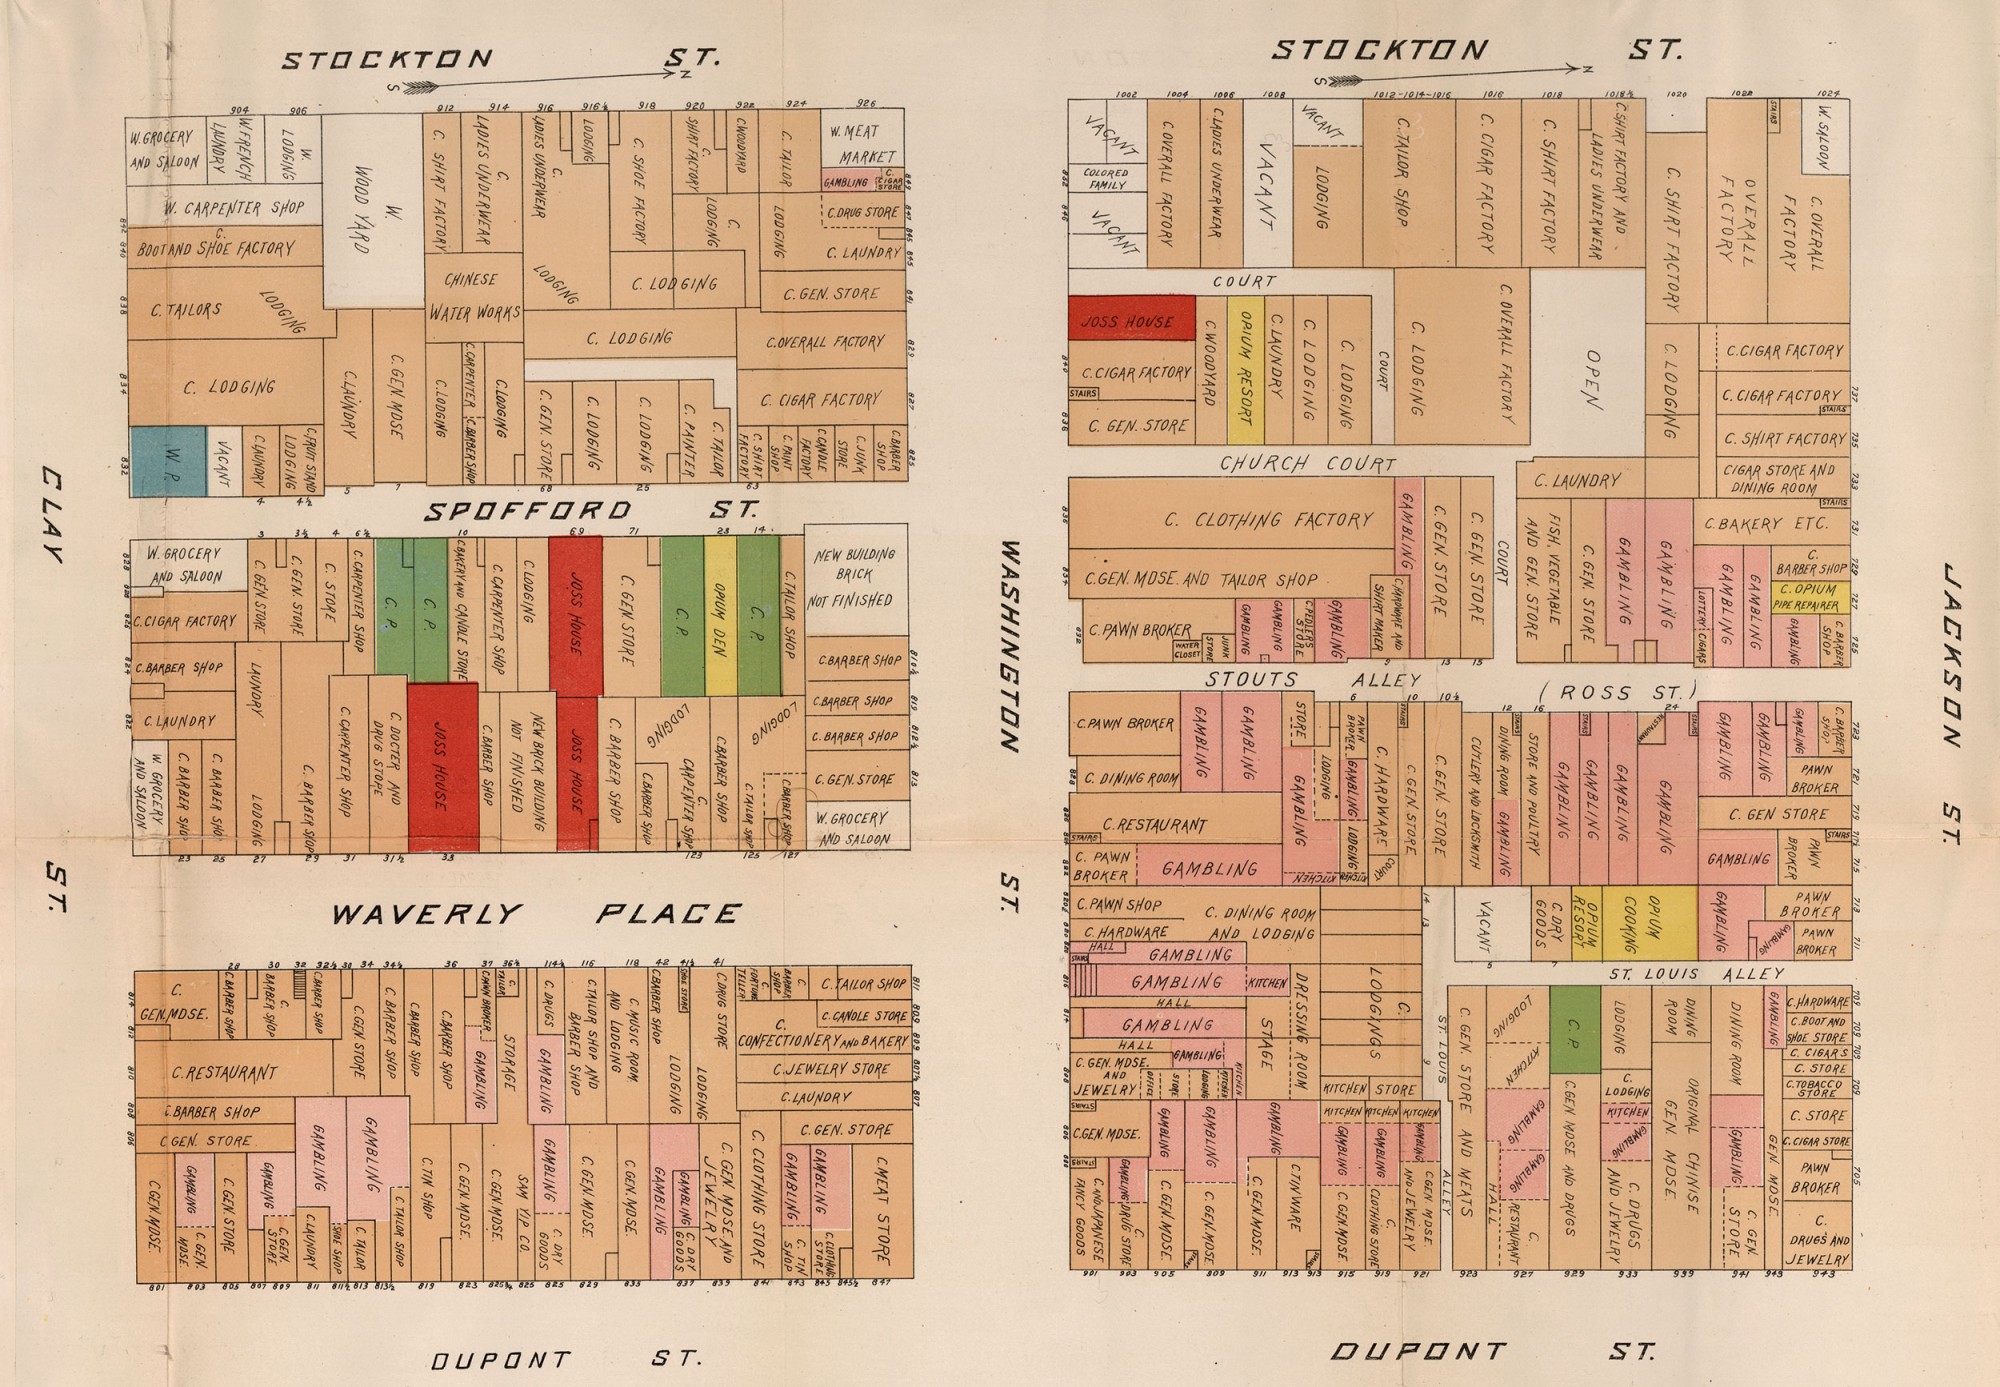
David Rumsey has uploaded a rare 1885 map of San Francisco that represents the height of the anti-Chinese movement in California. The map accompanied a lengthy report of the city’s Board of Supervisors, and is one of the earliest examples I have seen of a map designed to identify the distribution of ethnicity and vice (prostitution, gambling, and opium “resorts” or dens).

Click to open in new window, with higher resolution crops below.
Tim Gilfoyle, author of two comprehensive books on the urban underworld, told me he has never seen a historic map aiming to identify vice in such detail. In Contagious Divides, Nyan Shah writes that the map represented a new form of knowledge, ordering and making intelligible “the heretofore impenetrable and labyrinthine geography of Chinatown.” But that level of clarity is misleading. As Gilfoyle explained to me, the map only identifies the first floor of these establishment, missing both gambling dens below and brothels above.

In a way the map merges two earlier cartographic traditions. On the one hand it very much resembles the Sanborn Fire Insurance maps, which identified in great detail the composition of neighborhoods in order to assess liability. These maps have become a boon to researchers of genealogy, urban history, and the like. The Chinatown map similarly identifies individual businesses in order to assess the overall presence and threat of the Chinese to the city. But the map also evokes another tradition of mapping epidemic disease. In the antebellum era, yellow fever and cholera were mapped in several cities–most notably Baltimore, New Orleans, and Boston–in order to locate and identify the precise vector of the disease. In those maps, the city was dissected to individual components that may have contributed to the overall epidemic. Here, similarly, the Chinese “menace” is broken down into its component parts of gambling, drugs, and prostitution.

Click to open in new window.
The map–like the accompanying report–takes care to separate white and Chinese prostitution. The Board of Supervisors argued that white female prostitution had grown with the arrival of the Chinese in the city, for Chinese men were the primary patrons of white prostitutes [the Board observed a similarly offensive trend of white women living with Chinese men]. The map also drew attention to the many “Joss houses” of the city — houses of Chinese folk worship which the Board deemed idolatrous and only serving to justify further the engagement of vice.
The San Francisco map also anticipates the more famous maps of subsequent decades produced through Hull House in Chicago. Here for instance is Samuel Sewell Greeley’s four-sheet map of Chicago’s South Side in 1895.

Click to open in new window.
Ironically, these Chicago maps were designed for more “progressive” purposes of identifying the many immigrant and minority communities on the South Side, rather than as an instrument to isolate and vilify a particular group. This highlights the complexity involved with this type of map: the same technique of taking inventory and mapping a population could be used to serve very different agendas. For the map of San Francisco, important questions remain, particularly regarding its use and circulation.
Here is a detail of the Chicago map of “nationalities,” along with the legend identifying the ethnicity of each home.

Click to open in new window.
![]()
There was also a series of wage maps to accompany those of nationality, identifying the relative levels of income in each household. The black represented the lowest wage, so as to make it easier to identify the severest level of poverty. These maps were collaborations between several members of Hull House, most importantly Florence Kelley and Agnes Holbrook. They recorded their efforts with such detail (and acknowledge the Booth maps of London as their inspiration) that they merit a separate post–and more research on my part!

Click to open in new window.
The 1885 map of San Francisco courtesy of David Rumsey; the 1895 maps of Chicago courtesy of the Newberry Library’s digital collection. The 1885 Report of the Board of Supervisors can be found within William Farwell’s larger work, The Chinese: At Home and Abroad (1885).
Use controls to zoom and pan.
The Chinatown map used to hang above the urinal in the men’s room in the Big Four restaurant at the Huntington Hotel on Nob Hill. When they remodeled the bathroom, it disappeared. I used to always take out-of-towners to the Huntington for a drink, and pointed out the map to the men (and sometimes the ladies) as a curiosity of San Francisco’s past. I was always amazed at the cultural story it portrayed about The City’s olden days.
[…] green for Chinese prostitution, yellow for opium resorts, and blue for white prostitution. [via Mapping the Nation] By Editor, in (function (d, s, id) { var js = undefined, fjs = […]
[…] um exemplo – um mapa de onde ficavam as casas de jogos e prostituição em Chinatown, em São […]
[…] but also various forms of landed properties and their relationship with the government. This 1855 “vice” map of the Chinatown in San Francisco was created by the municipal government to locate places of gambling, prostitution and opium […]
Great work! Many thanks for preserving and writing about this map. I am in my 60’s and I vaguely remember seeing local maps growing up in the deep South. Our town’s map clearly showed black and white neighborhoods. Thanks again for this map.
[…] fine post by Susan Schulten at Mapping the Nation inspired me to cite it and comment briefly. Mapping vice in San Francisco pulls a selection of maps from the fabulous David Rumsey collection that illustrate the rise of […]
[…] written before about the effort of San Francisco’s city fathers in the 1880s to investigate Chinatown, part of a […]
[…] Author: Samuel Sewell Greeley, more on Newberry Library or Mapping the Nation […]