The earliest American attempt to chart climate?
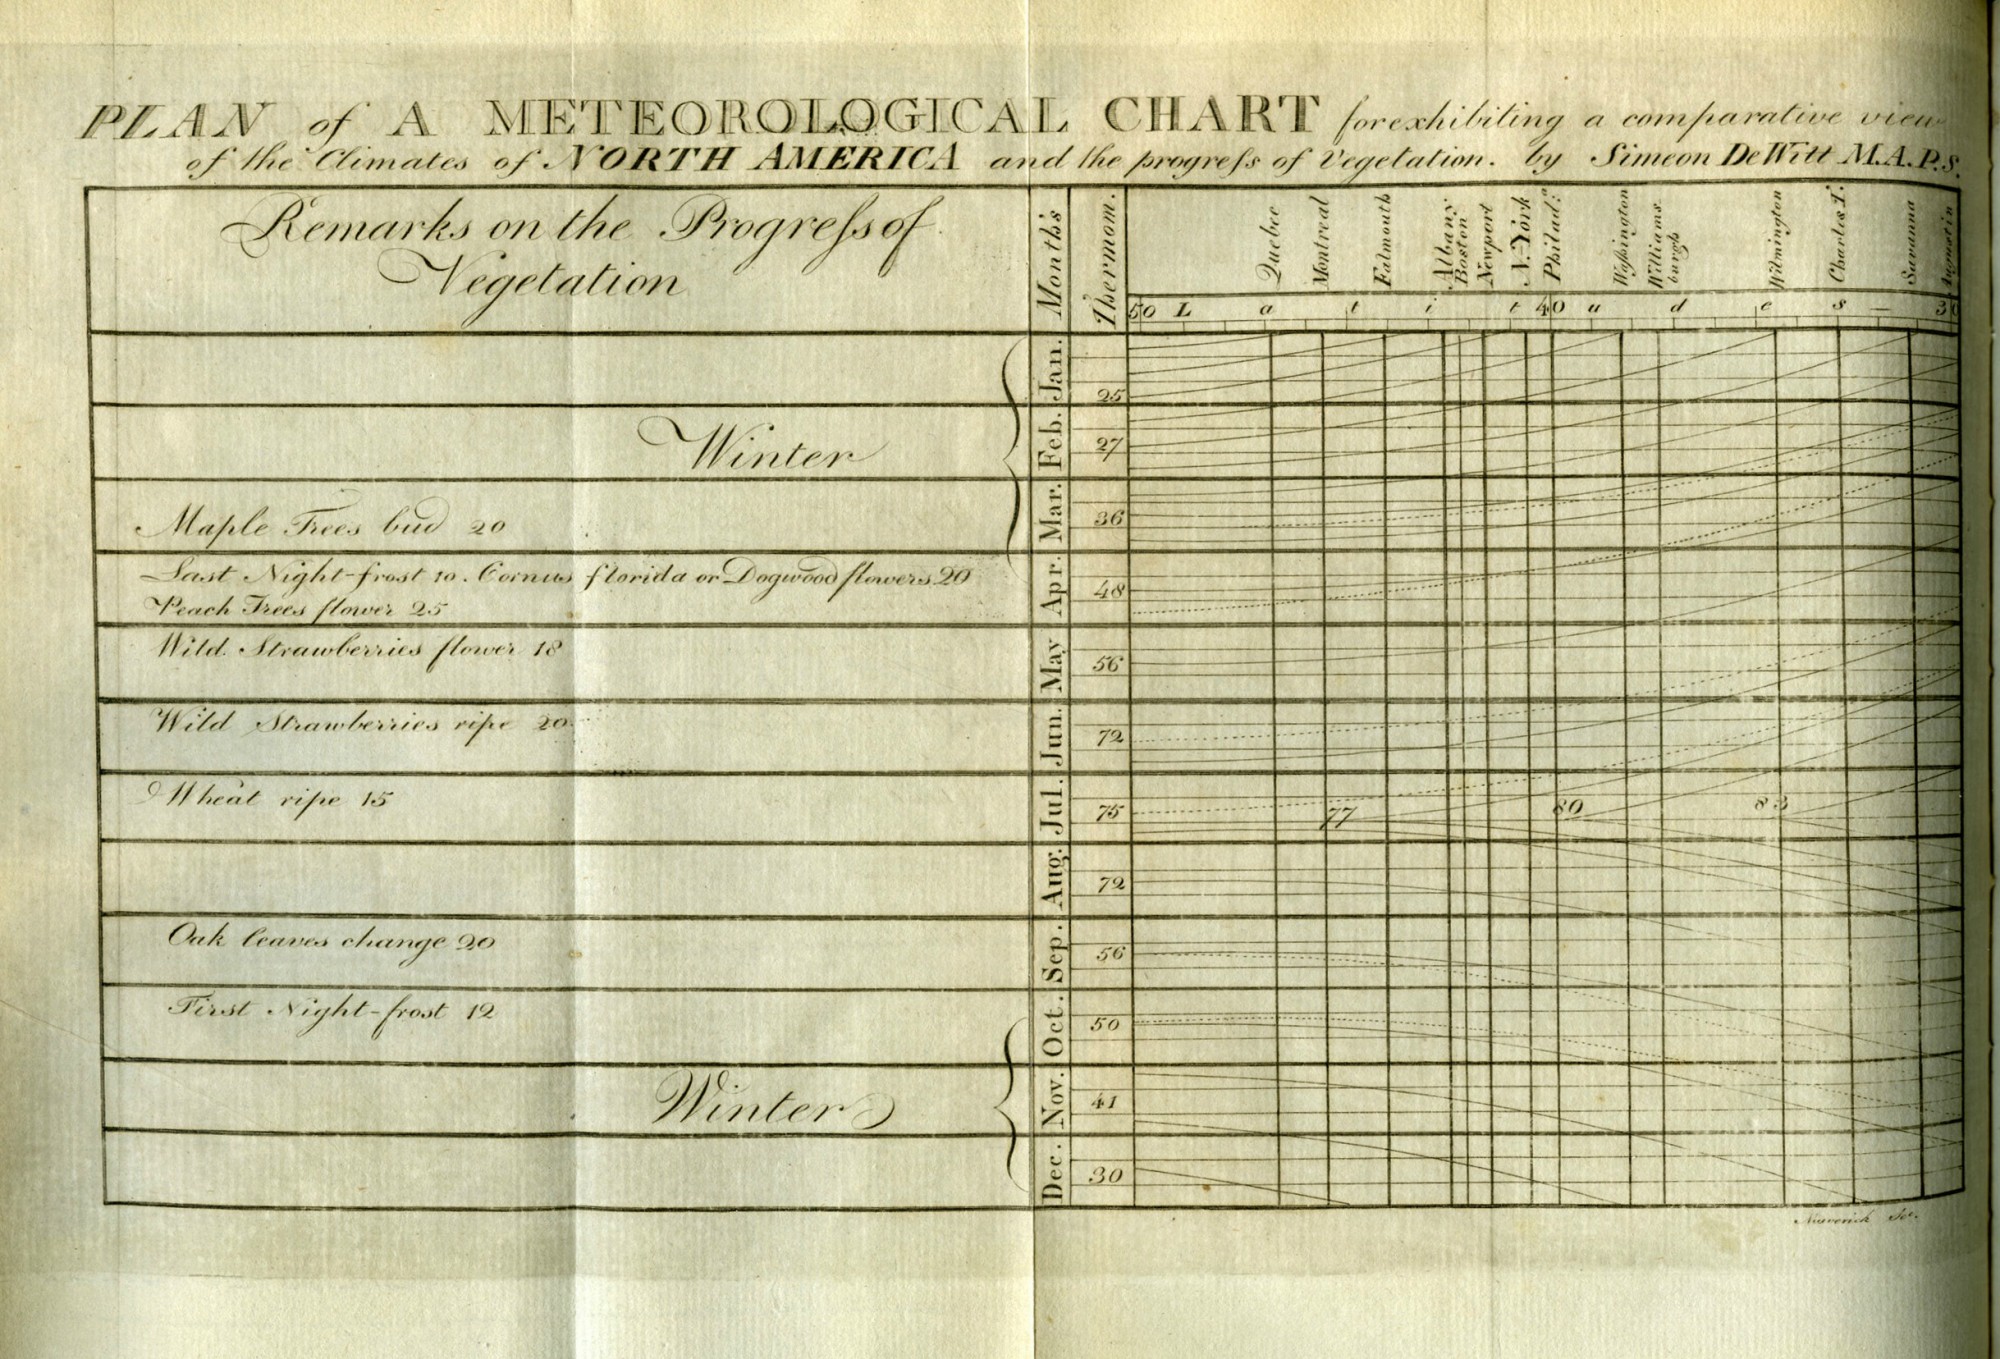
Last week I was delighted to find what I believe is the earliest American attempt to chart patterns of climate and its effect upon agriculture and vegetation, drawn by Simeon DeWitt in 1792.

Click to open in new window.
Dewitt had been a geographer and surveyor during the Revolutionary War, then appointed Surveyor of New York State thereafter. He published the chart alongside an explanatory essay in the first issue of the Transactions of the Society for the Promotion of Agriculture, Arts, and Manufacturers.
The chart is complex, and my grasp on it is still tentative, but it is important as the earliest example I’ve seen of an attempt to find patterns of temperature across time and space. Here is how it works: the notations at left describe some seasonal changes in vegetation common across the Eastern Seaboard, such as the first signs of tree buds, the ripening of wheat, or the first night frost.
The dotted lines on the chart connect these experiences of seasonal change at different locations to different moments of time, so that one sees the night frost arrives in northern latitudes as early as October, but months later in places like St. Augustine. These lines correlate, but do not always match, the solid lines that connect mean temperature in different places. DeWitt carefully differentiated these two lines to show that even the same temperatures produce different geographical effects.
What really strikes me is this last point: DeWitt was trying to uncover a pattern of the experience that we all know to be true: climate is not just a function of temperature, but also geography. He was trying to convey this dimensionality and dynamism. Michael Buehler, upon seeing DeWitt’s chart, wrote that it reminded him of Abraham Bradley’s landmark 1796 postal map of the United States. In the lower right corner, Bradley uses lines to show movement through time and space. I plan to investigate this connection further.
Another reason that I’m so taken by DeWitt’s chart is that almost all histories of weather mapping feature the isoline chart of Alexander von Humboldt as the first attempt to visualize patterns of climate in 1817.

Click to open in new window.
Humboldt’s chart is extraordinary. It sparked tremendous excitement in the United States and inaugurated a new purpose for cartography as a tool to connect the experience of space rather than simply the terrain. More importantly, it fueled interest in mapping climate, which culminated in the science of meteorology in the 1850s (I cover this extensively in chapter 3 of Mapping the Nation). In the antebellum era, such climate maps were energetically used to uncover the roots of epidemic disease, the behavior of storms, and the possibilities for agriculture and settlement in the American west. They even became popular school texts to illustrate the global variability of climate, agriculture, and “civilization.”
Humboldt’s chart was also crucial for illustrating the variations of temperature across latitude, and the dramatic differences between the climate at the coasts versus the interior. Finally, Humboldt’s isoline chart deserves our attention as a first for its ability to connect climates across the hemispheres.
Yet DeWitt’s chart is equally important for attempting, 25 years earlier than Humboldt, to translate what he called “the confused heap of meteorological tables” into a visual system that could be understood and amplified by others around the new nation. Certainly DeWitt himself was convinced of the potential of his system, and called for others to use and elaborate its precision. He called for two other charts: one for the American interior (which he knew would experience climate differently than the coasts), and one for Europe–together these might add up to a transatlantic visual synthesis of vegetation and agriculture.
Michael Buehler, of Boston Rare Maps, has reminded me that DeWitt’s chart, unlike Humboldt’s, is not a map, for it includes references to latitude but not longitude. Fair enough. But I’m floored by DeWitt’s effort to integrate the experience of climate.
I welcome your observations and comments on these remarkable and complex attempts to make sense of the environment. The DeWitt chart appears courtesy of the Special Collections Department at the University of Massachusetts Amherst, while the Humboldt chart appears courtesy of the Library of Congress.
Use controls to zoom and pan.
Wow! I had no idea what the first attempts to map weather and climate looked like and when they first appeared. This is especially relevant as we track climate change today. I received your book, Mapping the Nation, a few days ago and look forward to delving into more history like this. Taking one of your classes would be really fun, too, but alas, geography makes that unlikely.